VLPIM README
Overview
VLPIM is a comprehensive computational workflow for modulating the immunogenicity of virus-like particles through epitope identification, MHC-II binding evaluation, and structure analysis.
- Epitope prediction: Candidate epitopes predicted by NetMHCIIpan
- Immunogenicity analysis: Analyzing immunogenicity shift of candidate epitopes predicted by NetMHCIIpan
- Structural superposition: Structures comparative analysis between AF3 predicted structure and wild-type structure
Workflow
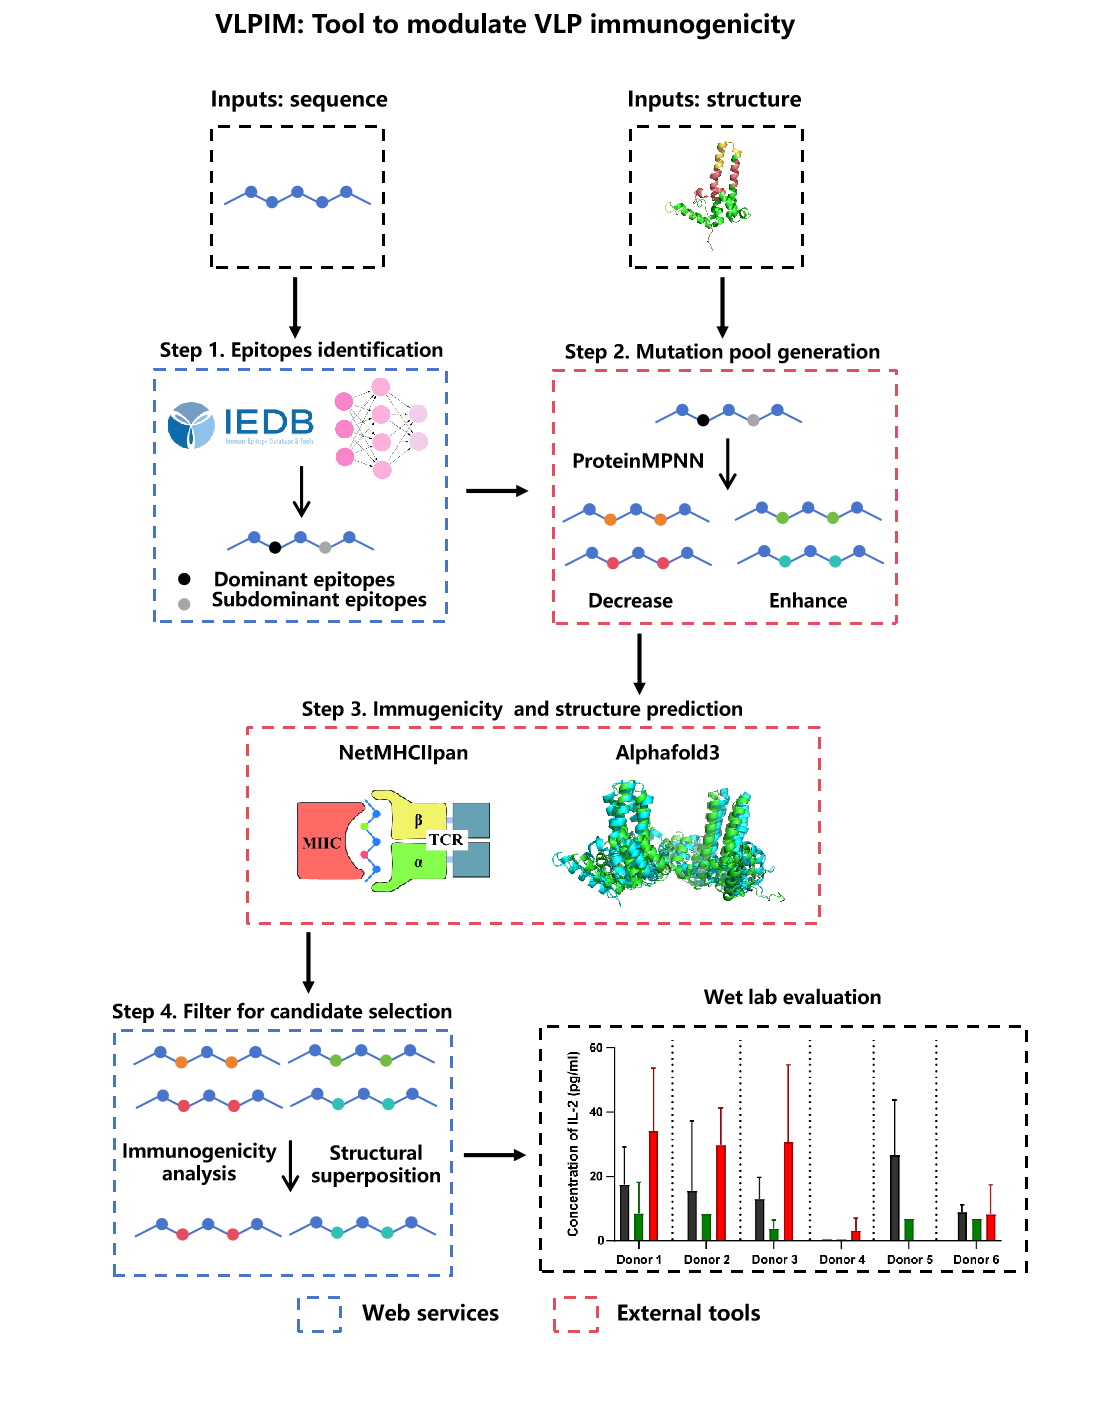
- Step 1: Dominant and subdominant antigenic epitopes are first identified using immune epitope databases and the NetMHCIIpan prediction model.
- Step 2: These epitopes provide the basis for generating a mutant protein library through ProteinMPNN-based deep learning methods.
- Step 3: Structural and immunogenicity predictions are then applied to evaluate the effects of mutations.
- Step 4: Candidate variants are further filtered using AF3 outputs, Cα RMSD, and Rosetta.
- Wet lab evaluation: Finally, the most promising mutants could be validated in experimental studies to assess their physicochemical properties and immunogenicity. AF3, Alphafold3; RMSD, root mean square deviation.
Usage Limits
The following practical constraints and parameter limits apply to the VLPIM web server:
Sequence and Input Limits
- VLP sequence length: Recommended up to 10,000 amino acids. Very long sequences may experience slower processing times.
- NetMHCIIpan file: Standard output format expected. Large files (>10MB) may require longer processing time.
- PDB structure files: Recommended for structures with up to 5,000 residues per chain for optimal performance.
Parameter Ranges
- Epitope number: 1-50 epitopes (default: 10)
- Epitope target length: 9-15 amino acids (default: 15 aa)
- RMSD cutoff: 0.5-500 Å (suggested range: 2-300 Å)
- RMSD max cycles: 1-20 iterations (default: 5 cycles)
Runtime Expectations
- Epitope identification: Typically completes within 5-30 seconds depending on sequence length and number of epitopes requested.
- RMSD calculation: Usually completes within 10-60 seconds for typical protein structures. Iterative alignment may take longer with higher cycle counts.
- API requests: Timeout set to 10 seconds for external API calls.
General Guidelines
- For best performance, use sequences and structures of moderate size (< 5,000 residues).
- Large batch analyses may require multiple sessions or splitting input data.
- Browser-based computation is performed client-side; ensure sufficient browser memory for large datasets.
- Results are computed in real-time and not stored on the server.
Privacy and Analytics
- Sequence and structure analysis is executed locally in the browser.
- Anonymous traffic analytics (GA4/Looker Studio dashboard) is optional and disabled by default.
- When analytics is enabled by the user, page-view statistics may be sent to Google Analytics.
Practical Website Example (Built-in Demo Data)
Follow the actual UI flow: load examples -> run calculations -> review outputs and export files.
This walkthrough is aligned with the current index.html UI and uses built-in sample files for a complete end-to-end run.
Step 1: Epitope identify
Open index.html, in Step 1 click Load example, then run Epitopes identification.
selected_epitopes.csv.
Step 2: Immunogenicity analyze (Step 4.1)
Go to Step 4.1, load seq-a .csv, select mode (enhance/reduce), then compute Sim score.
sim_im_reduce_combined.csv).
Step 3: Structural superposition (Step 4.2)
Go to Step 4.2, use Load example 1 or Load example 2, choose Kabsch/Iterative/TM-align, and click Calculate RMSD.
Legend: Sim indicates immunogenicity score analysis; RMSD indicates root mean square deviation; TM-score is shown when TM-align is selected.